
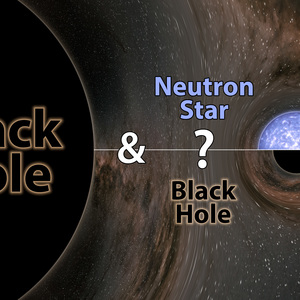
Visualization of the binary black hole merger GW190814
Visualization of the coalescence of two black holes that inspiral and merge, emitting gravitational waves. One black hole is 9.2x more massive than the other and both objects are non-spinning. The high mass-ratio amplifies gravitational-wave overtones in the emitted signal. The gravitational-wave signal produced is consistent with the observation made by the LIGO and Virgo gravitational-wave detectors on August 14th, 2019 (GW190814).
Details of the visualization:
The visualization shows the gravitational-wave signal and trajectories of the horizons of the black holes. It begins about 10 seconds before merger. At this stage, the black holes have about 160 orbits left until they merge, and the gravitational-wave frequency is about 20Hz. This inspiral is longer than any available numerical relativity (NR) simulations with physical parameters consistent with the event. Therefore, the visualization combines results from an effective-one-body model (the SEOBNRv4HM waveform model) and numerical relativity. In particular:
- The gravitational-wave strain is computed with the SEOBNRv4HM waveform model.
- The trajectories of the black holes and the shapes of their horizons: Up to 0.7 seconds to merger, the trajectory data is computed with the SEOBNRv4HM model, and the horizons are shown as coordinate spheres, with radii proportional to the their masses. For the last 0.7 seconds to merger, for the merger itself, and for the ringdown the visualization shows trajectories and apparent horizons from an NR simulation by the SXS collaboration of a system with the same mass ratio (SXS:BBH:1108).
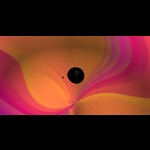
- The gravitational radiation is translated to colors around the black holes. Specifically, the colors represent the real part of the gravitational-wave strain with its inverse radial scaling removed for visualization.
- The left (main) panel always shows the full radiation content, with colors transitioning from blue, representing weak radiation, to orange, representing strong radiation.
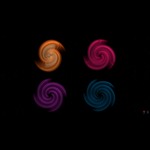
- Each of the four panels to the right shows a separate component (or overtone) of the gravitational-wave signal in a different color. From left to right and top to bottom, the panels show the quadrupolar (l=2, m=+/-2), octupolar (l=3, m=+/-3), hexadecupolar (l=4, m=+/-4) and 32-polar (l=5, m=+/-5) modes. Each mode is scaled in amplitude to its respective maximum. The colors in these four panels transition from dark to bright, representing weak to strong radiation of each respective mode.
Credit: N. Fischer, S. Ossokine, H. Pfeiffer, A. Buonanno (Max Planck Institute for Gravitational Physics), Simulating eXtreme Spacetimes (SXS) Collaboration

- Date
- June 23, 2020
- Location
- LIGO Lab
- ID
- ligo20200623v1
- Type
- Simulation
- Credit
- N. Fischer, S. Ossokine, H. Pfeiffer, A. Buonanno (Max Planck Institute for Gravitational Physics), Simulating eXtreme Spacetimes (SXS) Collaboration


