
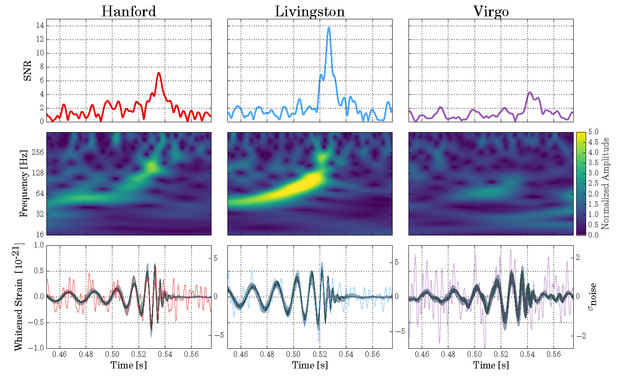
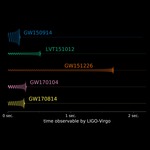
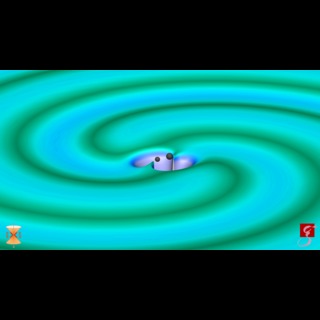
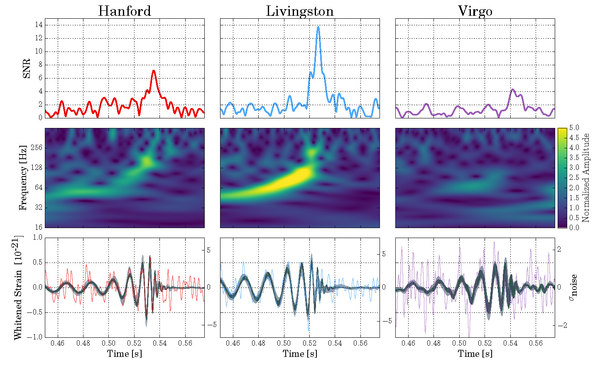
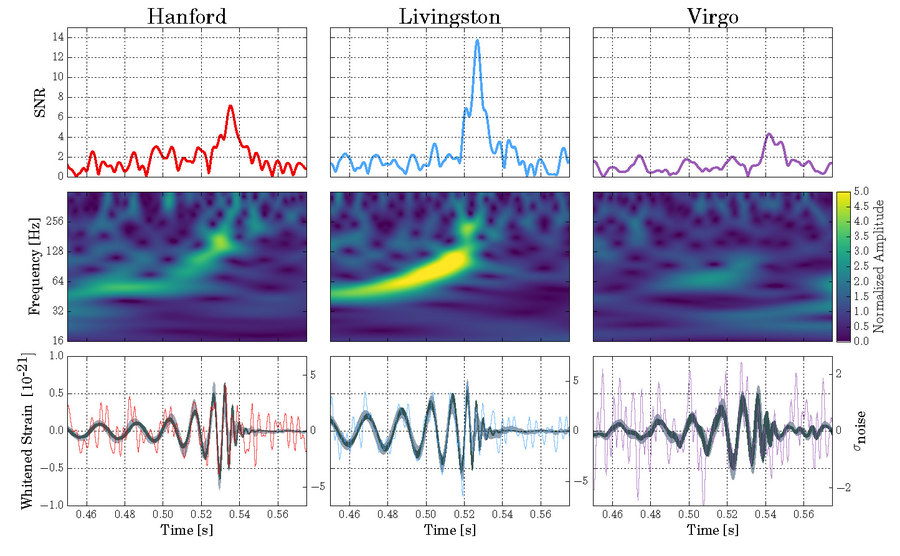
Gravitational wave signatures detected by each observatory
This graphic shows the data from each of the three observatories. The top graph shows the Signal to Noise Ratio - or roughly how significant the detection was. The middle graph shows the "chirp" or frequency shift across time. The bottom graph shows the wave form.
- Related News
-
Gravitational waves from a binary black hole merger observed by LIGO and Virgo
News Release
- Related Images
-

Gravitational wave signatures detected by each observatory
Image
-
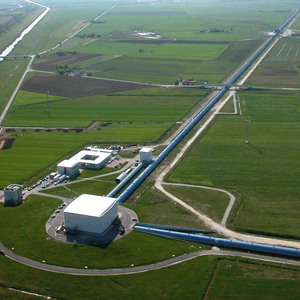
Virgo detector (aerial photo)
Image
-
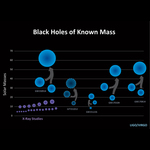
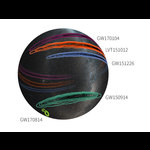
Known black holes as of Sept. 2017
Image
-
Gravitational waves detected by LIGO
Image
-
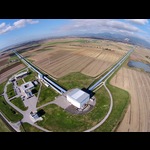
Virgo detector (aerial photo)
Image
-

GW170814 FactSheet
Image
-
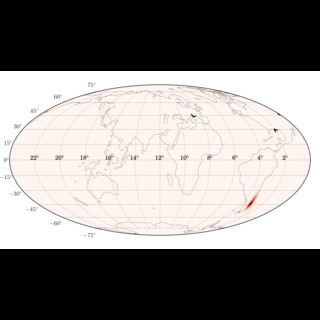
Skymap of gravitational waves Sept 2017
Image
Download Image
- JPG
About the Image
- Date
- September 27, 2017
- ID
- ligo20170927a
- Type
- Credit
- LIGO/Caltech/MIT/LSC


