
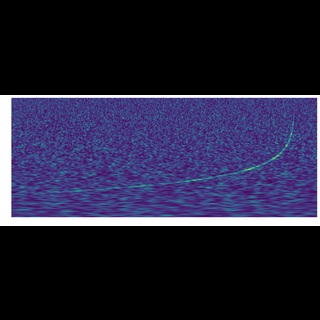
Hearing the Wave
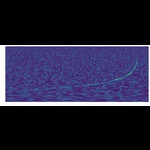
This is a time-frequency representation (spectrogram) of the LIGO detectors data which combines both the LIGO-Hanford and LIGO-Livingston data coherently for the binary neutron star merger GW170817. On the horizontal axis time is shown, and on the vertical axis the frequency content of the data. In color code the strength of the signal is shown as a function of time and frequency. This is analogous to listening to the source and turning to face it. In this case your ears are the two LIGO detectors. Initally, we show the data with the gravitational-wave signal removed. We reveal the observed data in real time, accompanied by the audio presentation of the plotted data. The signal is so strong that we see that the track of GW170817 for nearly 30 seconds. An audible chirp can also be heard at 0:29 just before the merger time - but you have to listen closely.
Credit: Alex Nitz/Max Planck Institute for Gravitational Physics/LIGO
- Related News
-
LIGO Detection of Colliding Neutron Stars Spawns Global Effort to Study the Rare Event
News Release
- Related Images
-
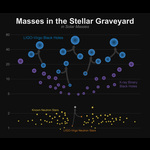
BH and NS Mass Chart
Chart Image
-
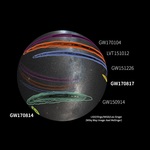
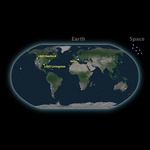
SkyMap
Image
-
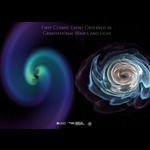
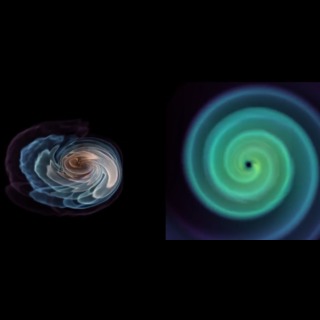
Filename: GW Versus Matter STILL
Image
-
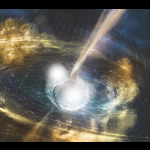
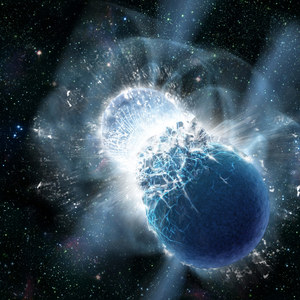
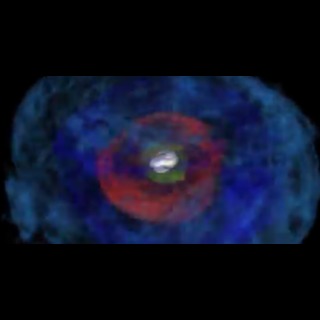
Cataclysmic Collision
Image
-
GW+EM Observatories Map
Image
-
Gravitational Wave Chirp Spectrogram
Image
- Related Videos
-
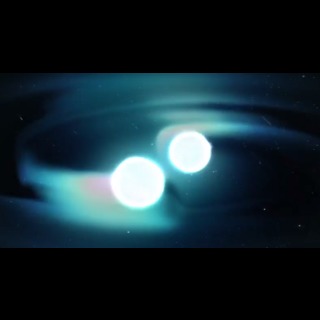
Neutron Star Merger
Education Video
-
LIGO and Virgo's 1st detection of gravitational waves from colliding neutron stars (Press Conference and Online Q&A Session)
News Conference Video
-
Jets and Debris from Neutron Star Collision
Education Video
-
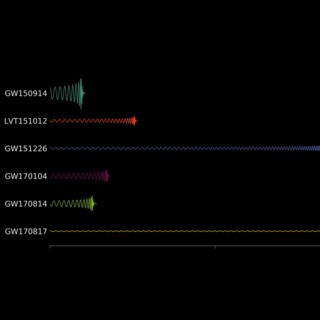
Variety of Gravitational Waves
Education Video
-
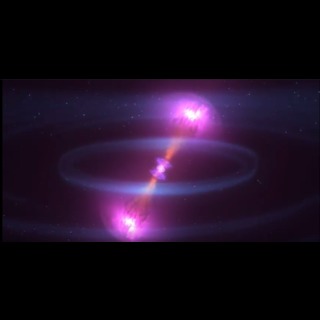
Last Dance of Neutron Star Pair
Education Video
-
Hearing the Wave
Education Video
-
Final Flight of Neutron Star Pair
Education Video
-
Zooming in on the Source of Gravitational Waves
Education Video
-
Ripples of Gravity, Flashes of Light
Education Video
- Date
- October 16, 2017
- ID
- ligo20171016v5
- Type
- Education
- Credit
- Alex Nitz/Max Planck Institute for Gravitational Physics/LIGO


