

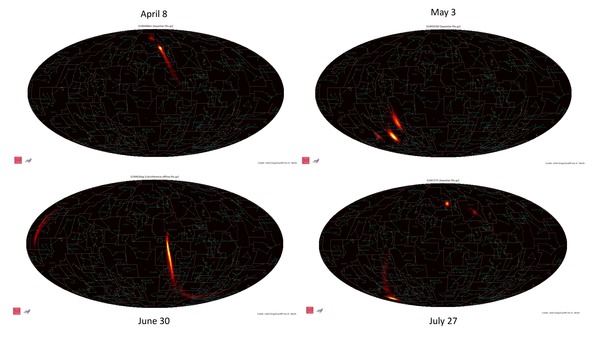
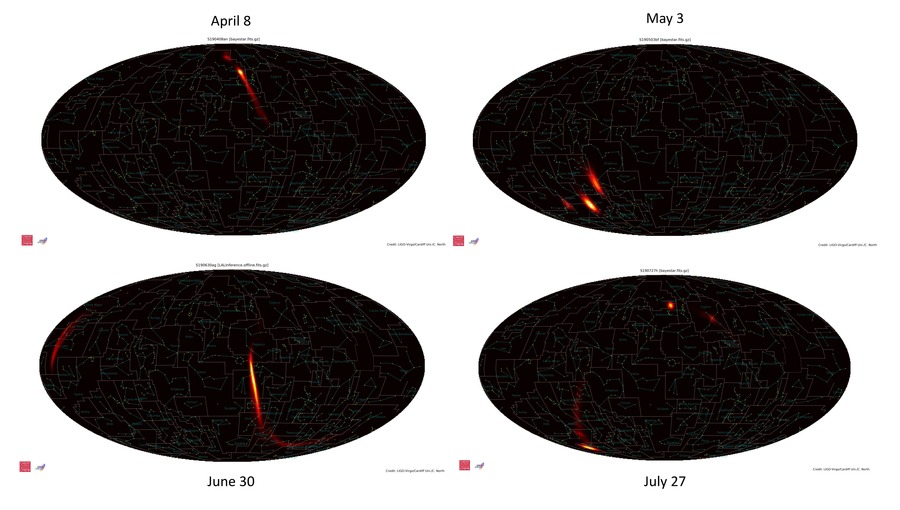
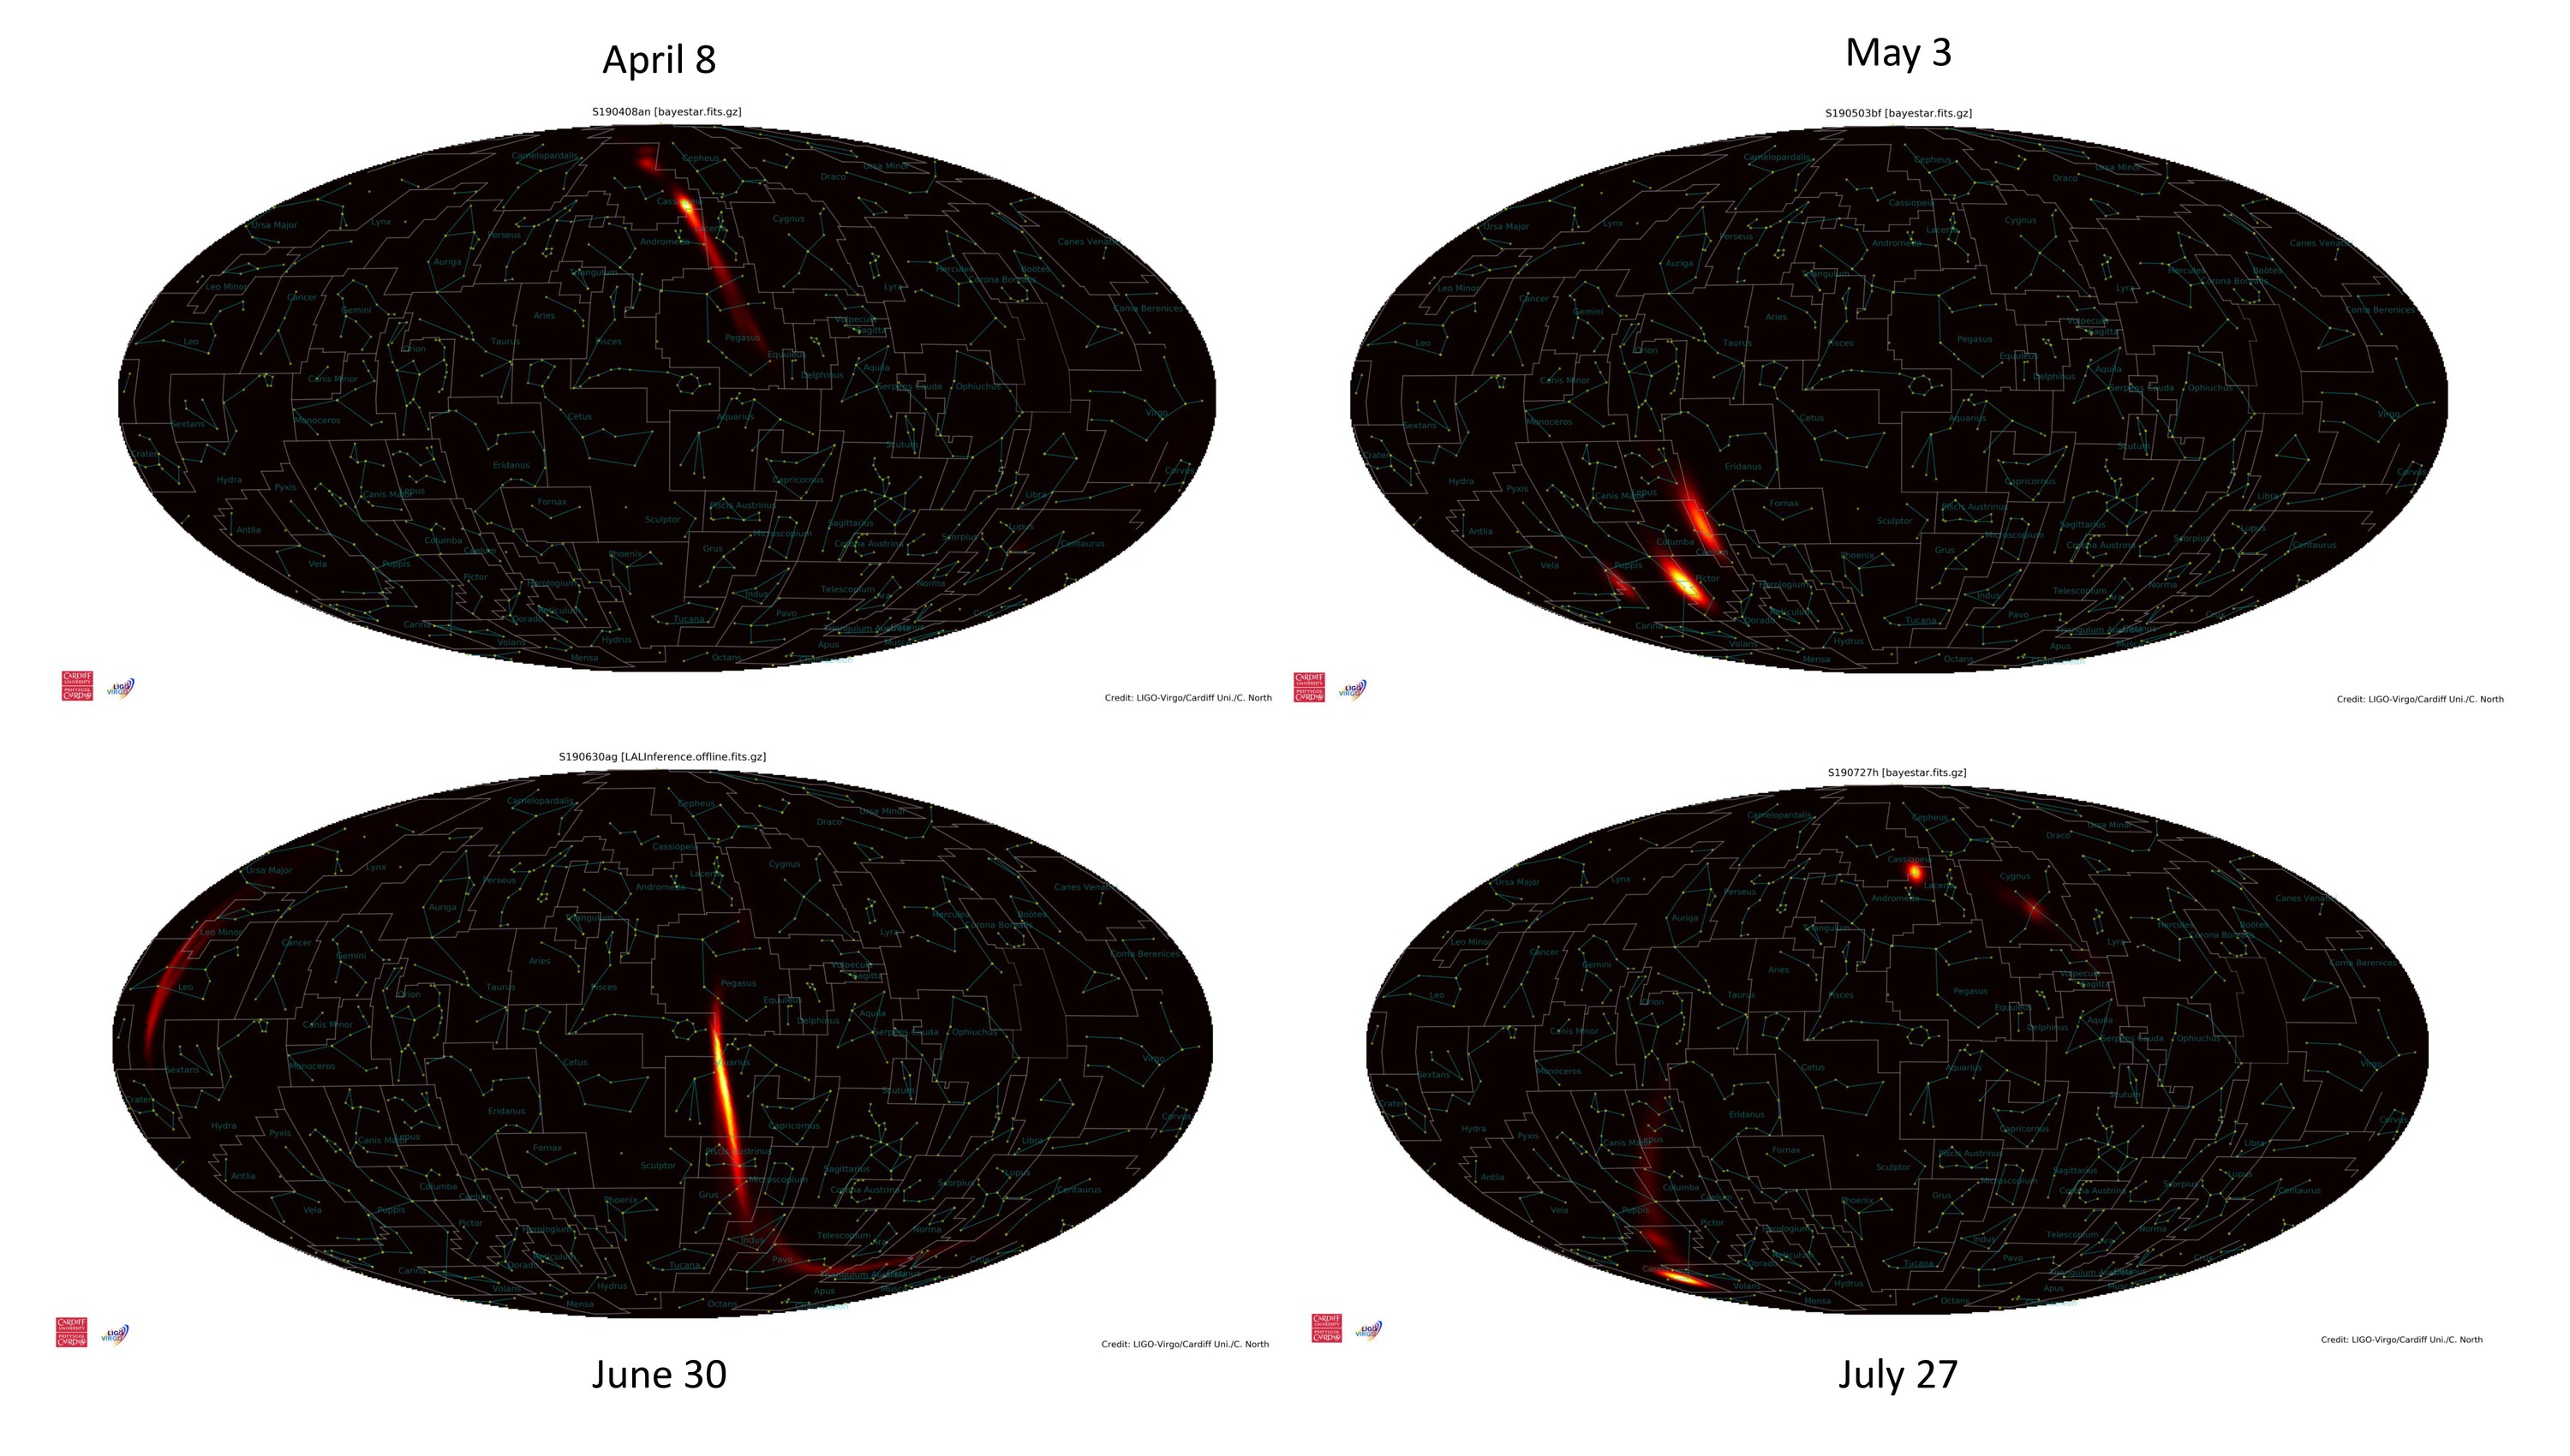
Four examples of maps showing the likely position on the sky of a candidate gravitational wave source. The orange blobs show the regions on the sky within which there is a 90% probability that each source lies. The size and shape of these regions depend on many factors, including how many detectors made the observation and how sensitive each detector was at the time. (For more maps like these visit: http://gwcat.cardiffgravity.org/skymaps Credit: LIGO-Virgo/Cardiff Uni./C. North)
Download Image
- JPG
About the Image
- Date
- August 13, 2019
- Location
- LIGO Lab
- ID
- Type
- Collage
- Credit
- http://gwcat.cardiffgravity.org/skymaps


